
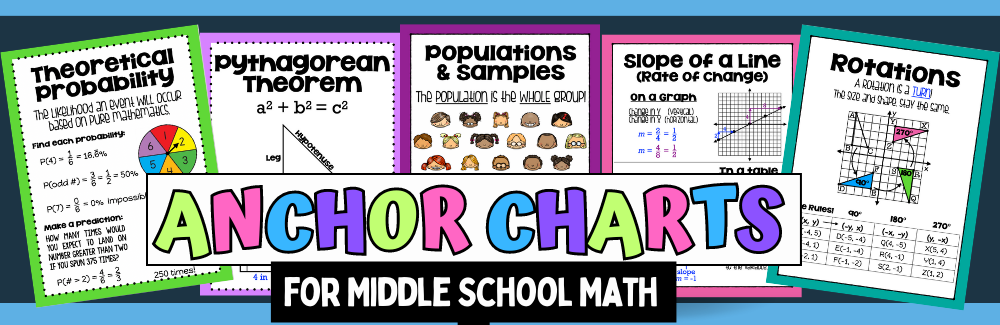
WHAT ARE ANCHOR CHARTS?
Anchor Charts are teaching tools that display important information from your lessons. They are usually displayed in the classroom on a bulletin board and are changed as you move from one topic to the next.
Anchor charts include definitions, key concepts, visual representations and examples. They make a great bulletin board that you can update as you begin each new unit!
WHY USE ANCHOR CHARTS?
- To create a year long reference for a quick summary of each lesson
- To support struggling learners with a visual representation so they can see the process
- To support independent work and self-directed learning
- To help students make connections between previously learned material and new concepts
- To make the learning process fun and engaging
TOO BUSY TO MAKE YOUR OWN ANCHOR CHARTS? (I feel your pain!😉)
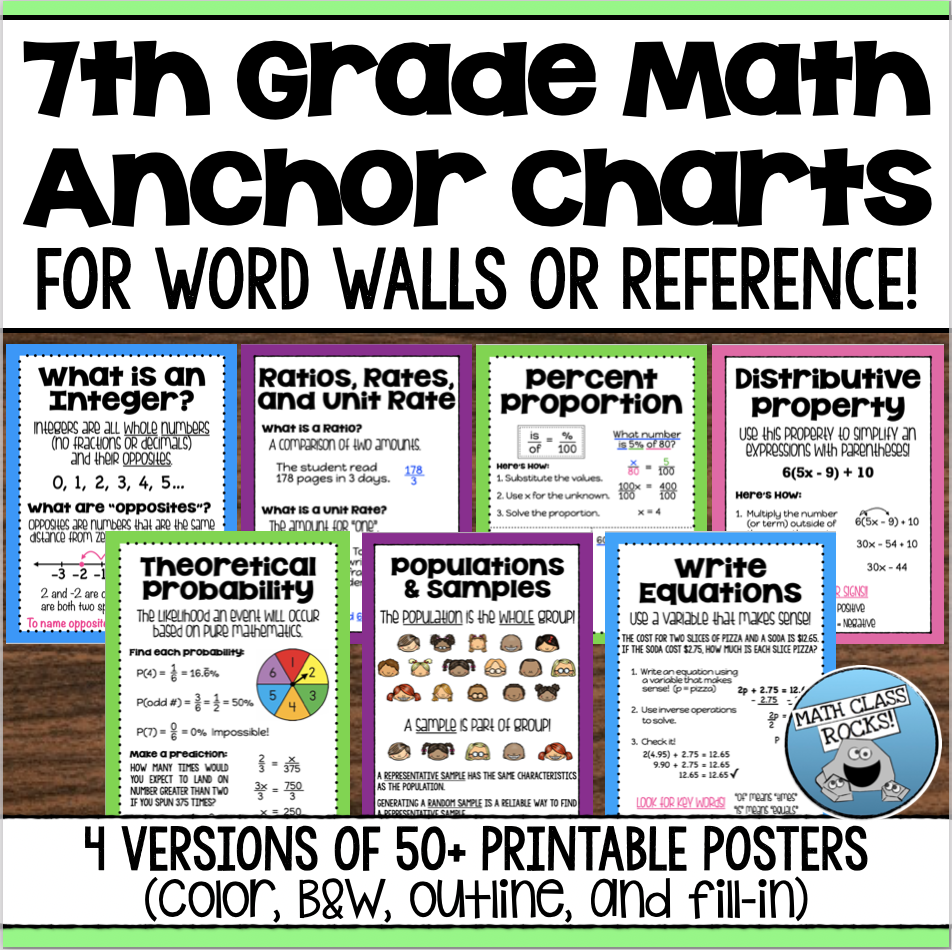
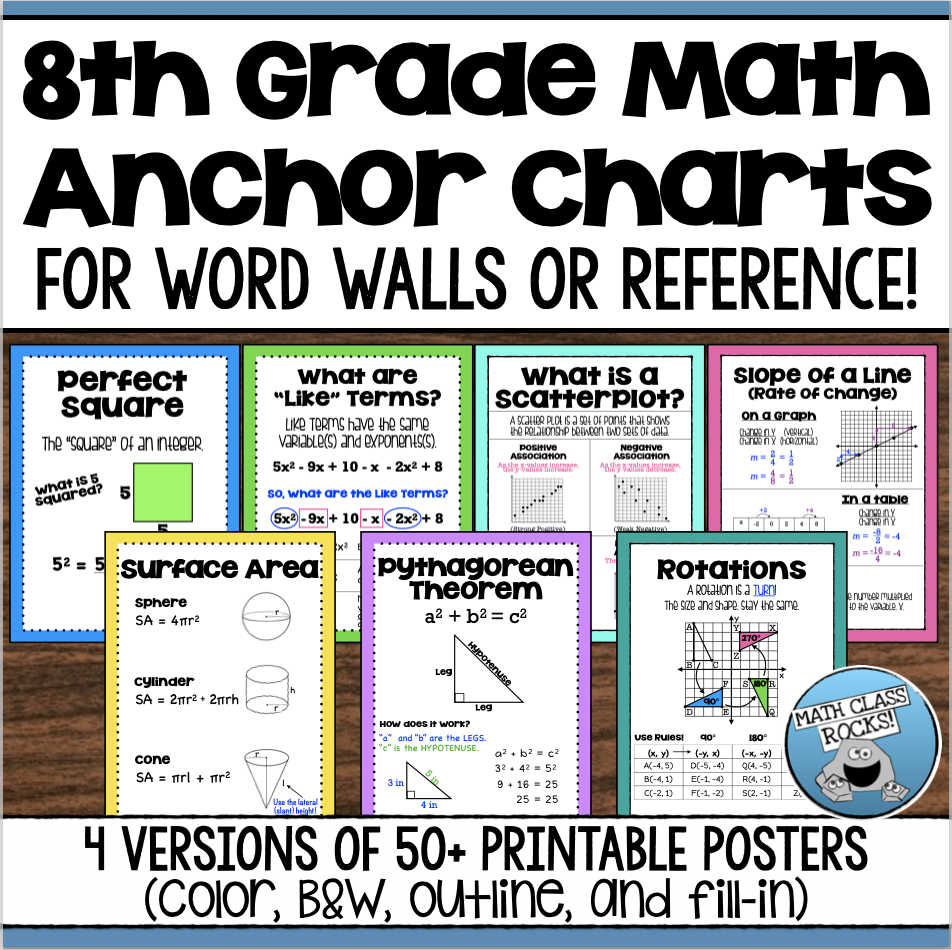
Don’t worry! You can purchase sets of anchor charts that are all ready to go… just print, laminate and “viola”! Anchor charts make a snazzy (yet educational) bulletin board that you can use all year long. Just change topics! Here are the “Probability” charts from the 7th grade set:
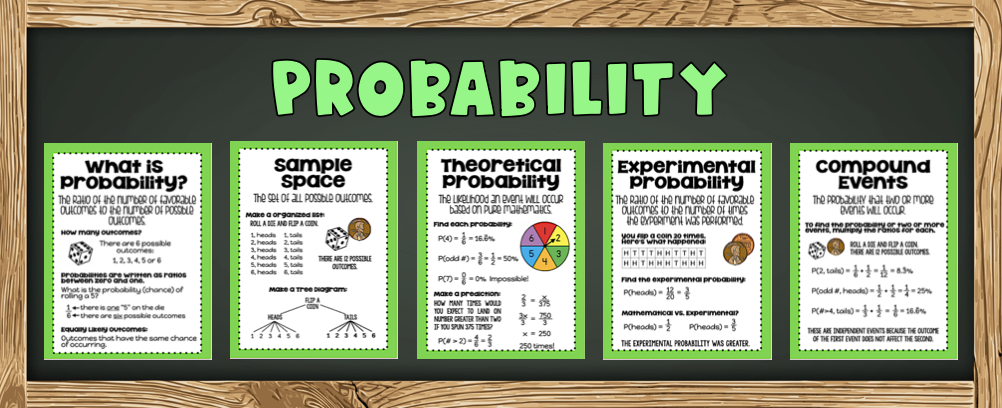
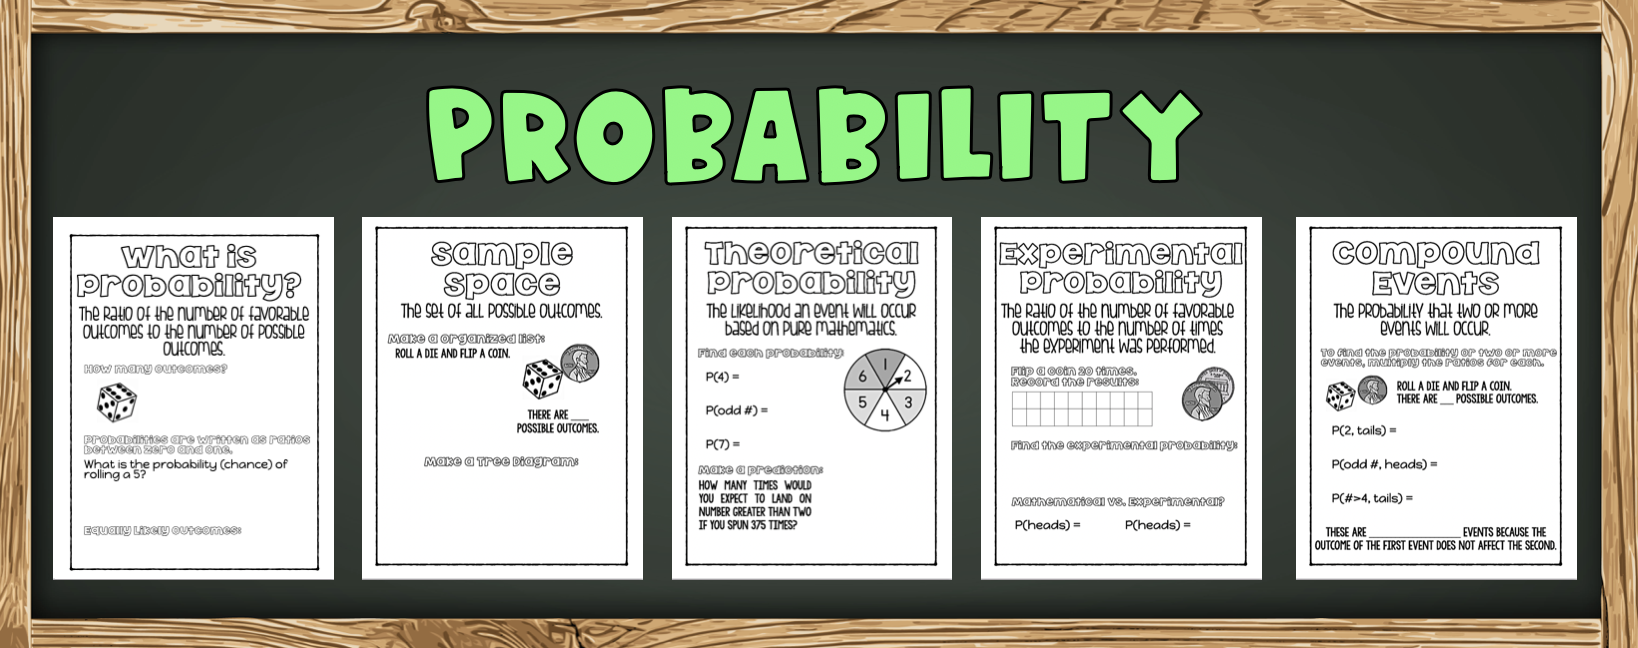
The charts shown below allow you and your students to fill in the examples. These are a great way to get the students engaged and involved in the lesson. Use the charts as a lesson to teach vocabulary, explain concepts and demonstrate how to solve problems through examples. Anchor charts can also be completed after the lesson to review. Once completed, display them in your classroom for quick reference any time!
INTERACTIVE NOTEBOOKS + ANCHOR CHARTS = SUCCESS🤗
In addition to displaying your anchor charts in the classroom, you can use them for interactive notebooks. It’s the perfect way to keep you students engaged in the lesson while having the most important information from the lesson at their fingertips to refer to throughout the unit and all year long. I’m REALLY big on organization and this is also a great way to help your students keep everything together with the pages in order!
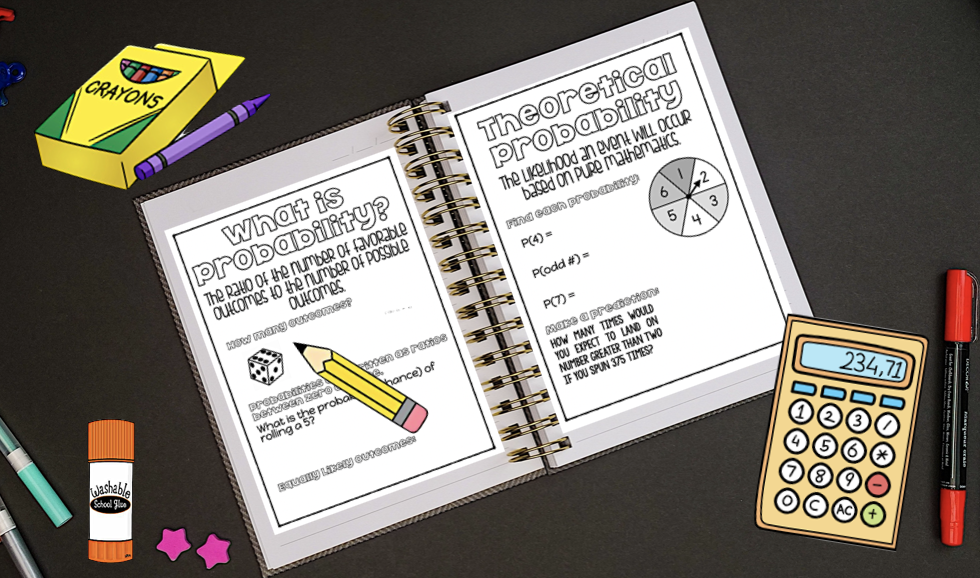
• Use the half-page “fill in” anchor charts for your interactive math notebooks. I prefer a notebook to a binder because the pages will stay in order and not get lost.
• Print copies of the anchor charts and fill them out together. Allow the students to make the pages “their own” by filling in the examples and adding color.
• Helpful hint: Don’t glue the page in until they are completely filled in and colored. Sometimes the glue makes it lumpy which is hard to write on and that can be frustrating.😡
On a side note, I HIGHLY recommend Elmer’s Spray Adhesive. Aside from the fact that it can be a little stinky (make sure to not breathe in too deeply), it is a game-changer, I promise! The pages dry COMPLETELY FLAT with no lumps at all. I use spray glue for everything and have introduced it to all of my teacher friends:)
Click on the pictures below to view (and maybe purchase) the perfect sets of anchor charts for your students!
If you have any questions or comments, please reach out. I’d love to hear from you! ~Kim